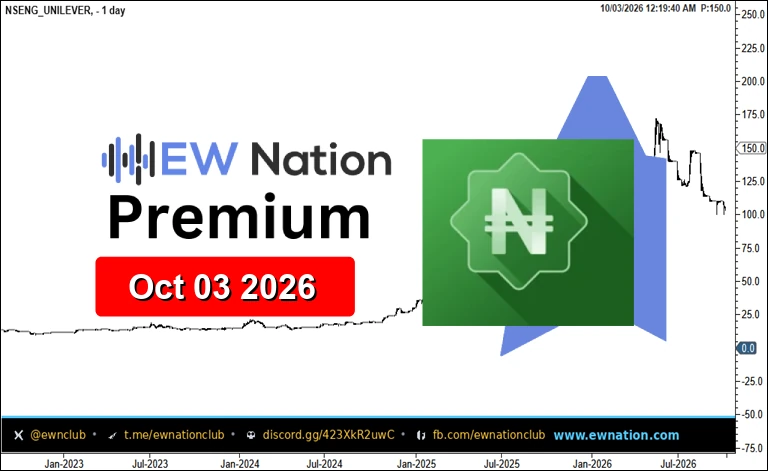
Bottom Line: Wave 4 triangle nearing completion; wave 5 advance toward 160–180 opens on triangle breakout
UNILEVER — Consumer Recovery Supports Earnings Floor; Wave 4 Triangle Resolving Toward Resumption
Unilever Nigeria Plc operates in one of West Africa’s largest fast-moving consumer goods markets, supplying household and personal care products to a population of over 200 million — a structural demand base that underpins long-term revenue visibility despite cyclical headwinds. The stock’s dramatic advance through 2024 and into mid-2025 reflected the broader repricing of Nigerian equities as the naira stabilisation narrative gained traction and inflationary pressures began to recede from their 2023–2024 peaks. Unilever Nigeria’s revenues benefited from aggressive price adjustments taken during the inflation surge, though volume recovery has been more measured as real consumer purchasing power remained constrained through much of 2025. Cost pressures from imported raw materials — a persistent feature of the Nigerian FMCG landscape — have eased modestly alongside the relative stability of the naira on the parallel market, offering some margin relief heading into 2026. The company’s relationship with its parent, Unilever Plc, provides access to global procurement networks and product innovation pipelines, a competitive moat that smaller domestic peers cannot easily replicate. Valuation, following the 2025 correction from peak levels near 180, has returned to a zone that looks more compelling on a price-to-earnings basis relative to the post-devaluation earnings base. With Nigeria’s broader macroeconomic trajectory pointing toward gradual recovery in household spending power, Unilever Nigeria sits as a bellwether for FMCG sentiment on the NGX, and any sustained improvement in volume offtake could represent a meaningful positive catalyst for earnings revisions.
Chart Update — 4H
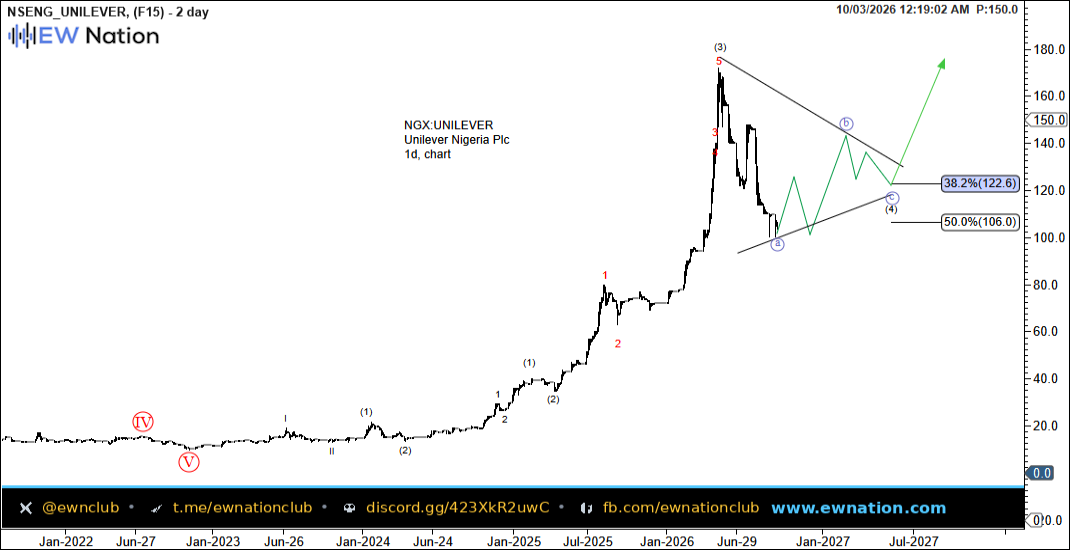
The daily chart for Unilever Nigeria shows a well-structured five-wave impulse completing near the 180 level in mid-2025, labelled as wave (3) of the broader advance, followed by a corrective sequence that has been unfolding as a contracting triangle — the classic Elliott Wave structure for a fourth wave. Price action has carved out a series of overlapping swings bounded by converging trendlines, with wave (a) setting the corrective low and subsequent sub-waves b, c, and d forming the compressing pattern visible on the chart. The current positioning near the 122–125 zone, marked as wave (4) completing, aligns with the 38.2% Fibonacci retracement level at 122.6, which represents a typical fourth-wave corrective target within a healthy impulse sequence. A decisive break above the upper boundary of the triangle would signal the completion of wave (4) and the onset of wave (5), with the projected target pointing toward the 160–180 area based on measured wave relationships. The 50% retracement at 106 remains the key invalidation level for the bullish count — a sustained close below that level would require reassessment of the wave structure.