Bottom Line: Wave 2 Correction Bottoming at 50–61.8% Fibonacci Zone; Wave 3 Advance Toward ₦2.00 Expected Next
ROYALEX — Nigerian Insurance Rebound Builds Case; Wave 2 Base Setting Up at Key Fibonacci Zone
Royal Exchange Plc remains one of Nigeria’s oldest composite insurers, operating across life, general, and healthcare insurance segments at a time when the National Insurance Commission is pushing through recapitalisation mandates that are reshaping the competitive landscape. The Nigerian insurance sector continues to attract renewed regulatory attention, with minimum capital requirements compelling smaller and mid-tier operators to either raise fresh equity or pursue consolidation, a dynamic that could benefit well-established names like Royal Exchange with stronger brand equity. Nigeria’s broader macroeconomic environment — marked by naira volatility, elevated inflation, and recovering consumer purchasing power — has weighed on discretionary insurance uptake, but mandatory product lines and increasing financial inclusion initiatives are providing a structural floor for premium income. Royal Exchange has made incremental progress on its health insurance and micro-insurance verticals, which offer higher-growth exposure relative to the saturated conventional general insurance market. The stock’s current price around ₦1.50 represents a significant discount to its 2024 highs above ₦3.46, reflecting market scepticism around earnings consistency and capital adequacy, but also presenting a valuation case for investors with a medium-term horizon. With recapitalisation deadlines looming, any confirmed equity raise or strategic partnership announcement could serve as a material re-rating catalyst for the stock.
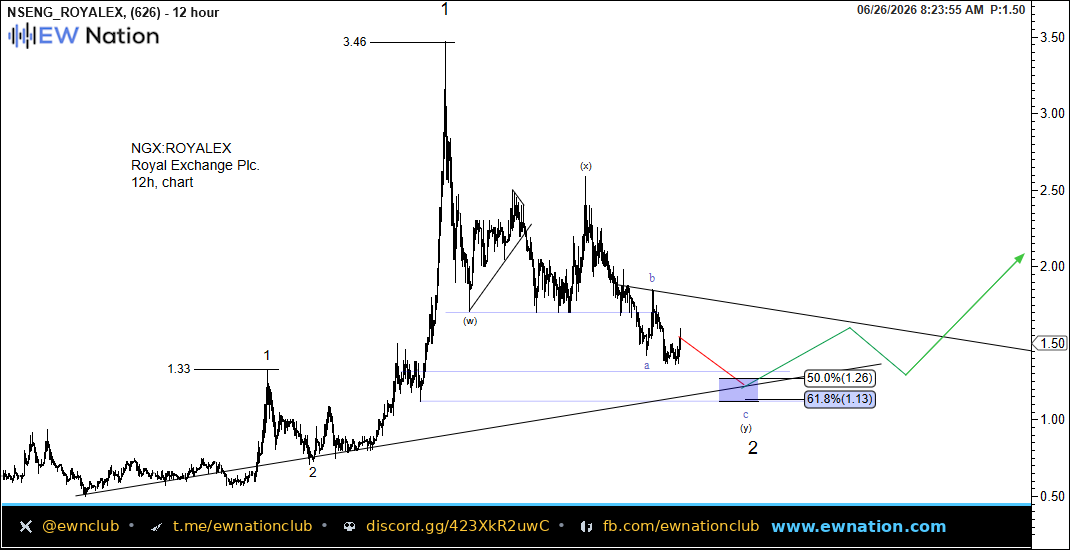
Chart Update — 4H
The 12-hour chart for ROYALEX shows a completed five-wave advance from the orange Wave 2 low near ₦0.50 up to the Wave 1 peak at ₦3.46, followed by a deep multi-phase corrective structure that has unfolded as a complex W-X-Y correction labelled across the chart. Price has now traced out the (y) leg of that correction, pressing into the highlighted Fibonacci confluence zone between the 50.0% level at ₦1.26 and the 61.8% retracement at ₦1.13, which represents the expected terminal range for Wave 2 of the higher-degree sequence. The corrective structure since the ₦3.46 peak shows internal subdivisions consistent with a flat or zigzag pattern for the final (y) wave, with the (a)-(b)-(c) labels pointing to a likely exhaustion of selling pressure within the blue support box. Provided the ₦1.13 level holds on a closing basis, the technical roadmap projects a Wave 3 advance targeting a return above ₦2.00 as the initial objective, with the green projection arrow on the chart confirming this directional bias.