Bottom Line: Wave (2) zigzag nearing completion near channel support; Wave (3) launch anticipated from current zone
EURUSD — ECB Policy Convergence Supports Euro Floor; Wave (2) Correction Approaching Terminal Low
The EUR/USD pair trades at 1.1433 in mid-July 2026, consolidating after a significant rally from parity lows that reflected the Euro Area’s gradual recovery from the 2022–2024 energy and inflation crisis. The European Central Bank has completed its rate-cutting cycle through early 2026, settling at a terminal rate that has narrowed the long-standing yield differential with the US Federal Reserve, reducing a key structural headwind for the Euro. Euro Area GDP growth has been modest but positive, supported by recovering industrial output in Germany, resilient services activity in Southern Europe, and a rebound in export demand from Asia. Inflation across the Euro Area has returned sustainably to the ECB’s 2% target, removing the pressure that previously weighed on consumer confidence and real purchasing power. On the US side, the Fed has also pivoted dovish, with markets pricing further rate reductions through late 2026, which continues to erode the dollar’s yield advantage and underpins the longer-term EUR/USD uptrend. Geopolitical risks remain present but contained, and the Euro has benefited from relative political stability in France and Germany following election cycles. Valuation models suggest the Euro remains modestly undervalued on a purchasing power parity basis near current levels, providing a medium-term fundamental anchor for buyers. Overall, the macro backdrop continues to favour a constructive medium-term outlook for EUR/USD once the current corrective phase runs its course.
Chart Update — 4H
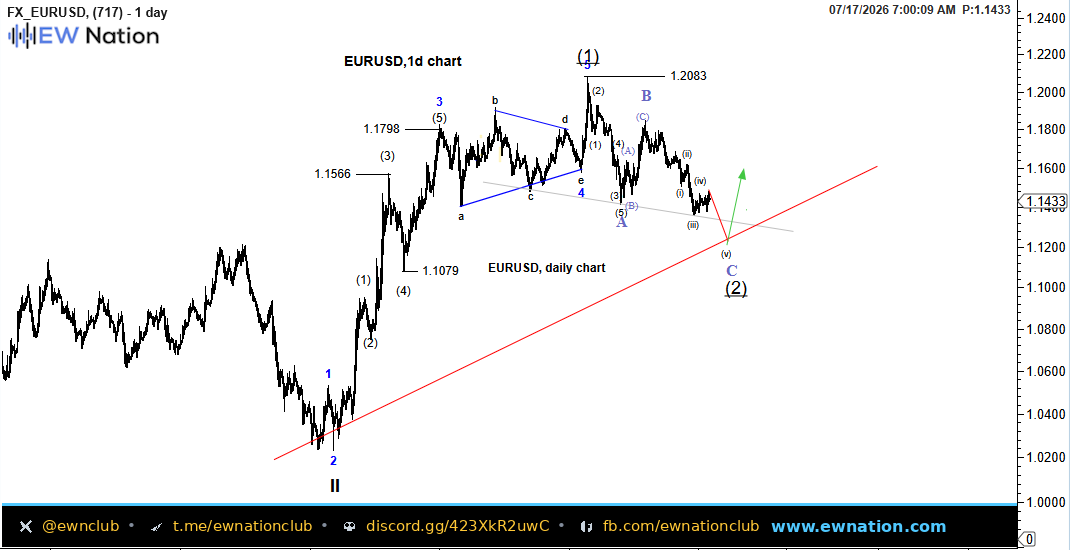
The daily chart of EUR/USD presents a clear Elliott Wave structure in which a five-wave impulse from the Wave II low near parity completed at the Wave (1) high of 1.2083, and price has since been tracing out a corrective Wave (2) pullback. Within Wave (2), an A-B-C zigzag structure is unfolding, with Wave A complete, Wave B having retraced toward 1.2083, and Wave C now in progress to the downside, subdividing into five waves of smaller degree. The current price action near 1.1433 sits within the terminal region of Wave C, with sub-waves (i) through (iv) visible and Wave (v) of C projected to complete the full corrective sequence near the long-term rising channel support. A green arrow on the chart projects the anticipated reversal from the Wave (2) low, targeting a resumption of the primary bull trend in Wave (3) toward and beyond 1.2083. Traders should watch for a confirmed reversal structure and momentum shift at the Wave (2) base before positioning for the next impulsive advance. A daily close back above the 1.1566–1.1600 zone would serve as an early confirmation that Wave (2) has completed and Wave (3) is underway.