Bottom Line: Wave (4) Triangle Near E-Leg Completion; Wave (5) Thrust Targets ₦85–90 on Breakout
CADBURY — Consumer Staples Resilience Meets Wave (4) Base; Wave (5) Rally Targeted Above ₦85
Cadbury Nigeria Plc remains one of the NGX’s most recognisable consumer staples franchises, operating across the chocolate, confectionery, and beverage segments under the Mondelēz International licensing umbrella. The company has navigated a challenging macro environment defined by naira depreciation, elevated raw material import costs, and persistent inflation — headwinds that squeezed margins through 2024 and into early 2025. However, Cadbury’s management has responded with selective price increases and a partial localisation of its input sourcing, helping to partially restore gross margins over recent reporting periods. Nigeria’s FMCG sector is beginning to benefit from a relative stabilisation in the naira following CBN’s managed float adjustments, which reduces the severity of FX translation losses on imported cocoa and sugar inputs. Consumer spending in the mid-to-premium food segment is recovering gradually as real wages adjust and urban households rebuild discretionary budgets after the subsidy-removal shock of 2023. Cadbury’s brand equity in the Bournvita and Tom Tom categories continues to support pricing power, providing a floor to volumes even during periods of consumer belt-tightening. With the stock having corrected significantly from its mid-2025 highs near ₦74, the current price zone around ₦62 represents a materially lower entry relative to the company’s earnings recovery trajectory. If the macro backdrop continues to stabilise into H2 2026, a re-rating toward fair value multiples consistent with regional FMCG peers appears well-supported by improving top-line momentum.
Chart Update — 4H
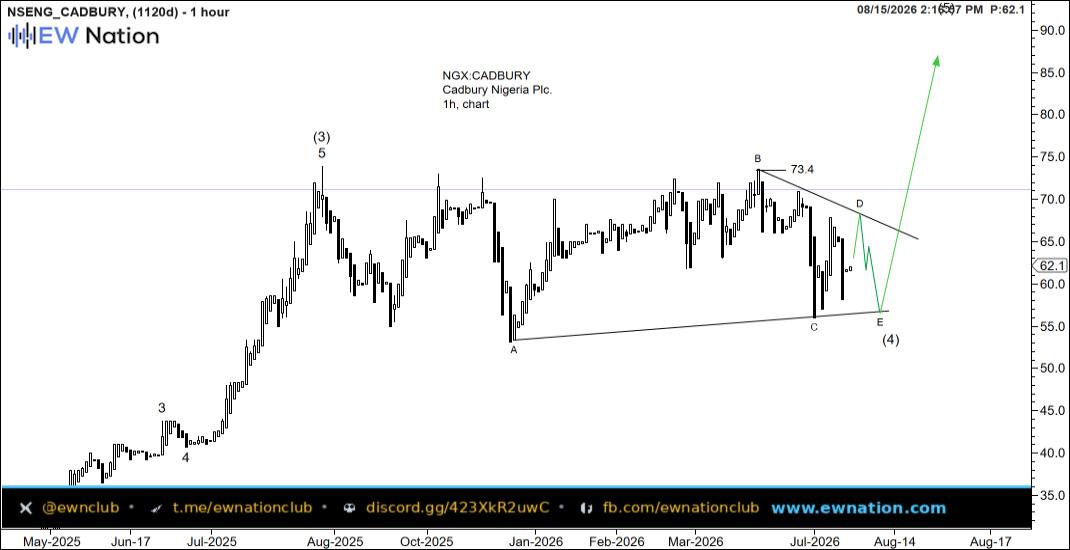
The 1-hour chart of Cadbury Nigeria illustrates a well-defined Elliott Wave triangle forming as wave (4) — a corrective structure bounded by converging trendlines connecting the August 2025 low at point A and the March 2026 low at point C on the lower boundary, with the upper boundary capping the B and D rally legs near the ₦73–74 zone. Price has traced five clear sub-waves within this triangle (A-B-C-D-E), with the E wave now pressing toward the lower boundary in the ₦55–56 area, consistent with typical triangle termination behaviour. Once wave (4) completes at or near the E leg low, the structure projects a powerful wave (5) thrust targeting the ₦85–90 region, in line with the measured move expectation from triangle width added to the breakout point. The current price near ₦62 represents an intra-E-wave bounce, suggesting the final low may not yet be in — traders should watch for a decisive undercut of the C-wave low near ₦56 to confirm E-wave completion before positioning for the bullish resolution. A sustained reclaim above ₦70 on volume would be the first structural signal that wave (4) is complete and wave (5) has commenced.