Bottom Line: Wave II double correction nearing (Y) low near ₦8.9; Wave III impulse expected on channel break
VFDGROUP — Holdco Discount Narrows; Wave II Base Forming Near ₦8.9 Support
VFD Group Plc, Nigeria’s diversified financial holding company, operates across microfinance banking, asset management, real estate, and fintech through a portfolio of investee companies, giving it a broad but complex earnings profile that the market has historically discounted relative to net asset value. The stock has shed significant ground from its 2024 peak near ₦17.1, reflecting a combination of sector-wide de-rating in Nigerian alternative finance, tightening liquidity conditions, and investor preference for larger-cap banking names during the high-interest-rate cycle. Nigeria’s Monetary Policy Rate has remained elevated, compressing margins across the microfinance and consumer credit segments that underpin several of VFD Group’s subsidiaries, weighing on near-term earnings visibility. However, the Central Bank of Nigeria’s signals toward a gradual easing cycle in the second half of 2026 could materially improve the cost-of-funds environment for VFD’s lending-side portfolio companies. The holdco structure continues to trade at a steep discount to the sum-of-parts valuation of its underlying stakes, a gap that activist-minded investors and insiders have historically moved to close through buybacks and strategic asset realisations. Management’s continued focus on growing its fintech and digital lending book addresses the fastest-expanding segment of Nigerian consumer finance, providing a medium-term revenue diversification runway. At current levels near ₦10.9, the risk-reward profile is increasingly asymmetric for investors with a twelve-to-eighteen month horizon, provided the macro backdrop cooperates with rate normalisation.
Chart Update — 4H and 1 Day
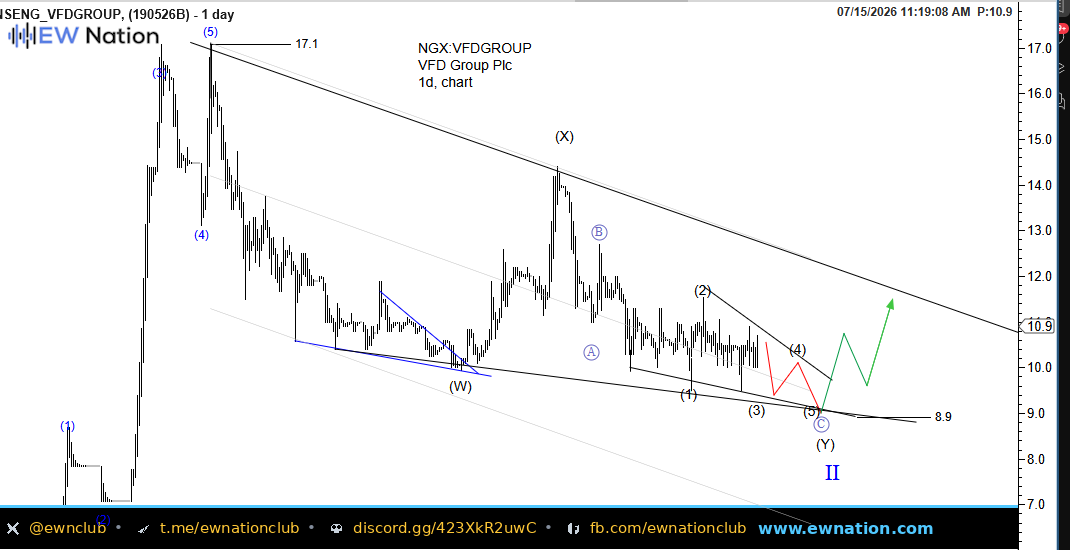
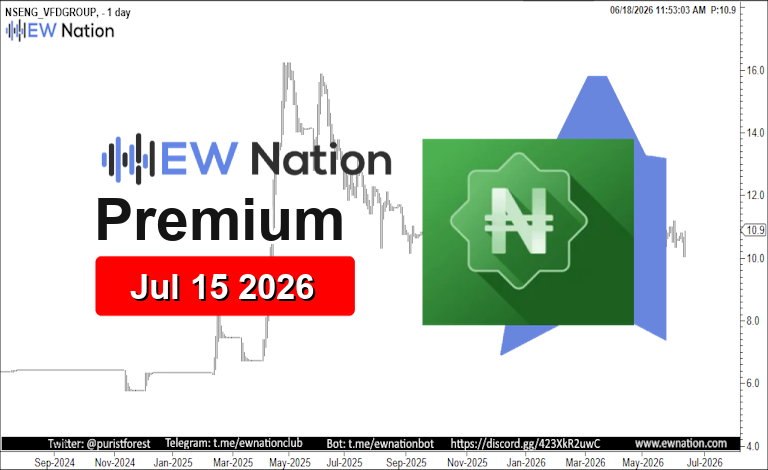
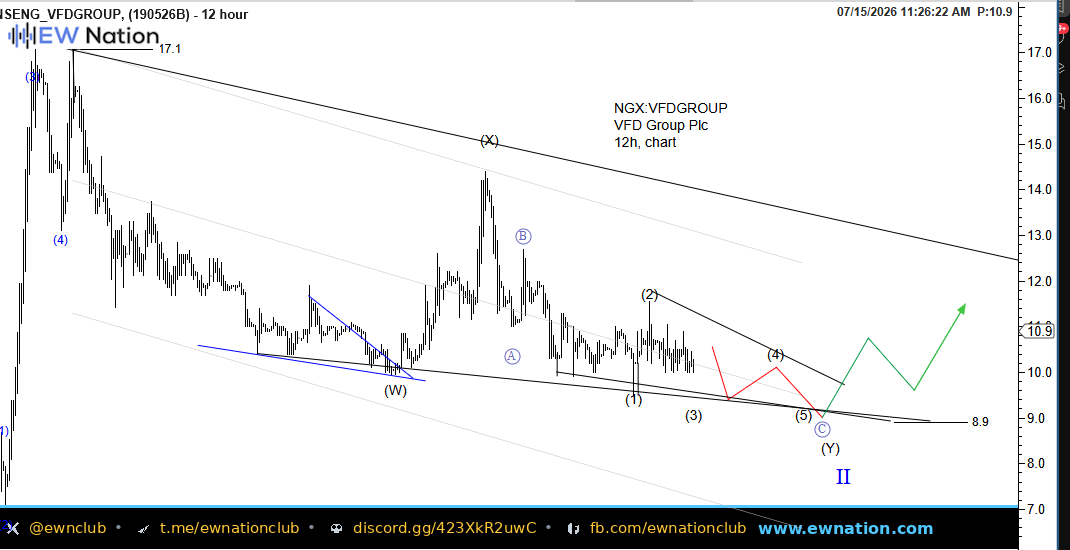
On the 12-hour chart, VFDGROUP is declining within a well-defined falling channel that has contained price since the ₦17.1 peak, with the current structure labelled as a W-X-Y double corrective sequence completing Wave II at the macro degree. The (Y) leg of this correction is itself unfolding as a five-wave impulse to the downside, with waves (1) through (3) already printed and a minor bounce into wave (4) currently in progress before a final wave (5) thrust is anticipated toward the ₦8.9–9.0 support zone, which aligns with the lower boundary of the falling channel. The daily chart reinforces this picture, showing price repeatedly respecting a strong horizontal demand cluster in the ₦8.9–9.5 area, consistent with a corrective Wave II low being established through accumulation rather than a clean capitulation flush. Once wave (5) of (Y) completes and the channel’s lower boundary is tagged, the count projects a significant impulsive Wave III advance that would first target a break above the upper channel boundary, with the green projection on both timeframes pointing toward a recovery well above ₦11 and potentially retesting the ₦13–14 region in the initial impulse leg.
Bottom Line: Wave II double correction nearing (Y) low near ₦8.9; Wave III impulse expected on channel break