Bottom Line: Wave (2) Base Forming at 61.8% Support; Wave (3) Impulse Targets 8.00 on Confirmation
CIC — Kenya Insurance Sector Recovery Drives Premium Growth; Wave (2) Low Forming Above 3.796 Support
CIC Insurance Group remains one of Kenya’s most strategically positioned composite insurers, with exposure across life, general, and medical underwriting lines that collectively benefit from the country’s expanding middle class and deepening insurance penetration rates. The Kenyan insurance sector has recorded steady gross written premium growth as regulatory reforms under the Insurance Regulatory Authority push greater product formalisation and bancassurance uptake, providing a structural tailwind for CIC’s distribution model. On the macroeconomic front, easing inflation and a relatively stable Kenya shilling following the turbulence of 2024–2025 have improved the real purchasing power of policyholders, reducing lapse rates and supporting renewal ratios across the industry. CIC’s medical and life segments have shown the strongest recovery momentum, with group medical schemes benefiting from increased corporate uptake as Kenyan employers expand employee benefit packages post-pandemic. Investment income, which forms a critical pillar of insurance profitability, has been supported by elevated Treasury bill yields maintained by the Central Bank of Kenya, boosting the group’s fixed-income portfolio returns and cushioning combined ratios. Valuations at current price levels remain undemanding relative to regional insurance peers, with the stock trading well below its 2025 peak near 6.50, offering a meaningful discount to intrinsic value for investors willing to absorb near-term technical consolidation. The upcoming half-year results cycle is expected to confirm continued improvement in the claims loss ratio, with management’s cost rationalisation programme having materially reduced administrative expense growth over the past two reporting periods.
Chart Update — Daily and 1 Day
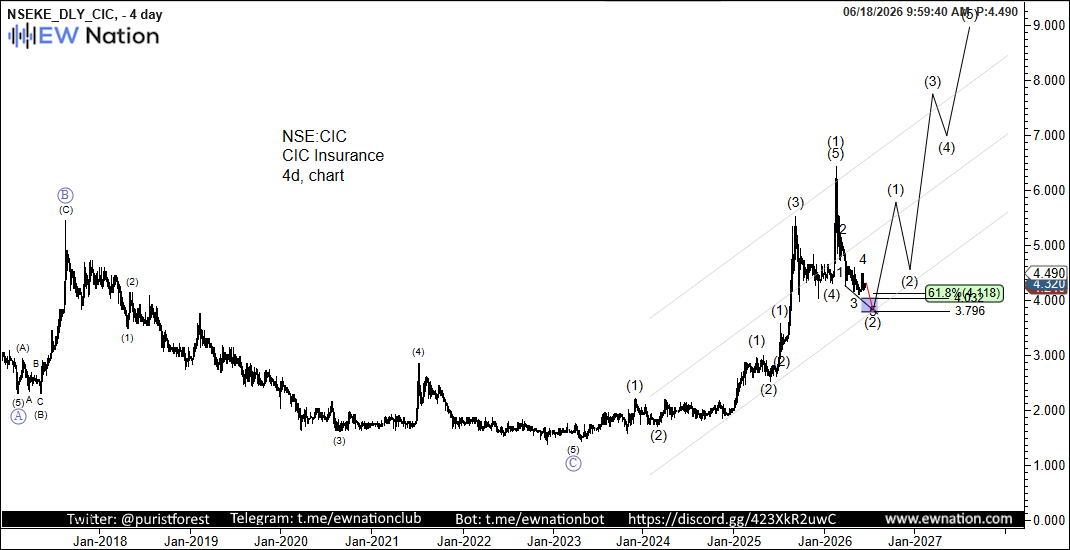
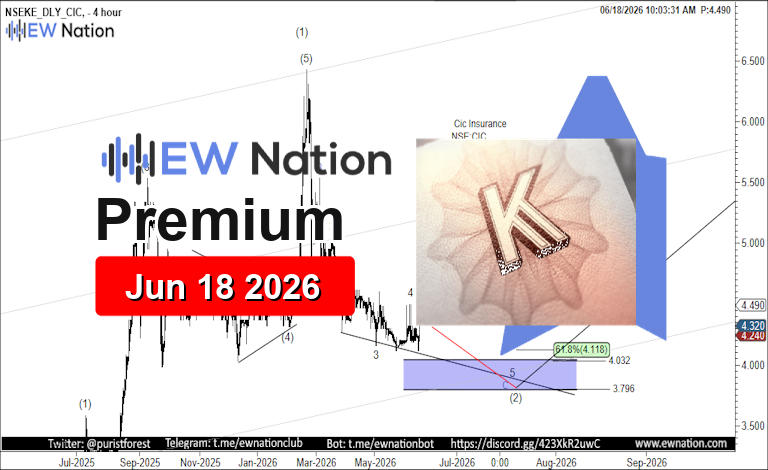
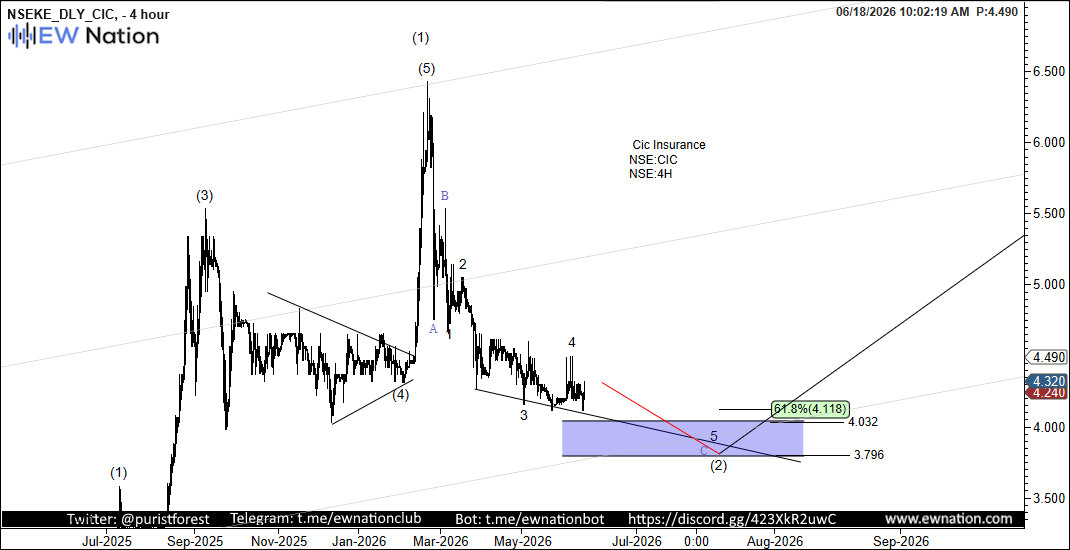
On the 4-hour chart, CIC is tracing out the terminal leg of a corrective Wave (2) sequence, with price compressing into a blue consolidation zone between 3.796 and 4.118, the latter representing the 61.8% Fibonacci retracement level that defines the ideal wave (2) termination range. The sub-wave structure labels waves 3, 4, and 5 still resolving to the downside within this box, suggesting the final flush toward the 3.796 low has not yet completed, consistent with a classic fifth-wave ending diagonal or terminal impulse into support. The intraday chart is trending within a descending channel bounded by a red resistance trendline above and horizontal support at 3.796, with the lower channel boundary providing the wave floor from which Wave (3) of the next impulsive advance is projected to launch. On the 4-day chart, the macro Elliott Wave picture is unambiguously bullish: price completed a multi-year corrective cycle at the 2021 lows near 1.00 and has since developed a clean five-wave impulse structure, with the current pullback representing Wave (2) of a larger degree third wave that targets 8.00 and beyond. Once Wave (2) confirms its low above 3.796, the subsequent Wave (3) advance is projected to extend sharply, with the channel upper boundary on the 4-day frame converging near 5.40–5.50 as the first meaningful resistance zone. Both timeframes align in confirming that the present price level around 4.49 is within the buy zone, with downside risk well-defined and asymmetric upside potential underpinning the bullish wave count.
Bottom Line: Wave (2) Base Forming at 61.8% Support; Wave (3) Impulse Targets 8.00 on Confirmation