Bottom Line: Wave ii base tightening near 2.7 Fib support; wave iii advance toward 6.5+ expected next
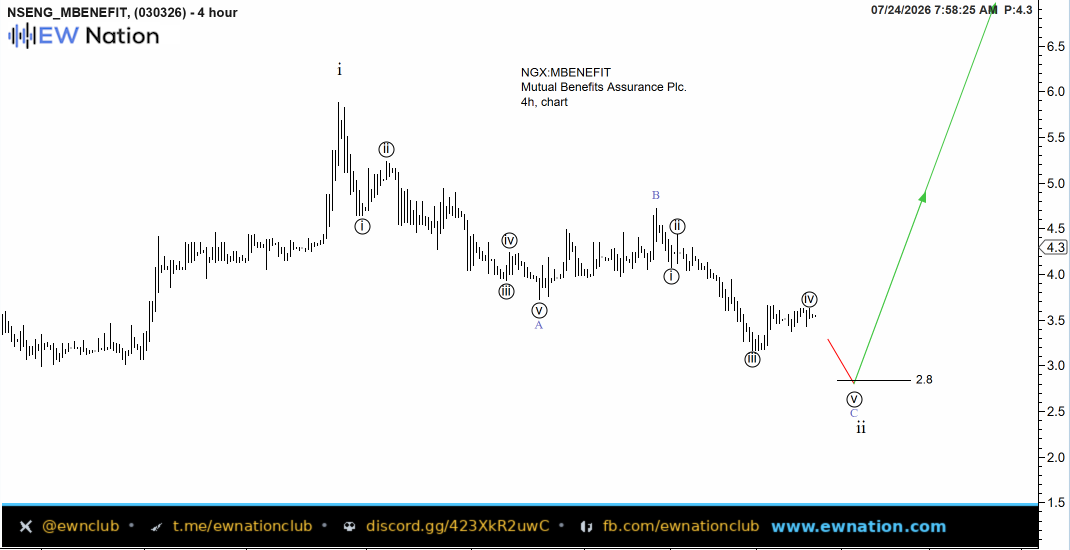
MBENEFIT — Nigerian Insurance Demand Recovering; Wave ii Base Forming Near 2.7–2.8 Support
Mutual Benefits Assurance Plc operates within Nigeria’s non-life and life insurance segment, a sector that has historically been underpenetrated yet is now receiving structural attention as the Central Bank of Nigeria and NAICOM push for recapitalisation and broader financial inclusion. Nigeria’s ongoing economic stabilisation, anchored by a more orthodox monetary policy stance and recovering consumer purchasing power in select urban centres, is gradually improving insurance penetration rates. The company’s core earnings are tied to premium income from life assurance, general business, and health-related policies, all of which benefit from a rising formal-sector workforce and growing SME activity across Lagos and Abuja corridors. Valuation for MBENEFIT remains compelling at current price levels relative to book value, particularly as peers in the sector trade at similar or elevated multiples despite weaker underwriting metrics. Recapitalisation requirements imposed by the regulator are expected to drive consolidation, and Mutual Benefits’ balance sheet positioning could make it either an acquirer or a more attractive standalone entity. Rising yields in the fixed-income market also support investment income, a critical contributor to insurance company profitability in Nigeria. The macro backdrop of naira stabilisation, while still fragile, reduces currency translation losses on dollar-denominated reinsurance obligations, offering incremental margin relief. Collectively, these dynamics support a medium-term fundamental case for MBENEFIT as the sector re-rates on improved regulatory clarity and earnings visibility.
Chart Update — 4H and 1 Day

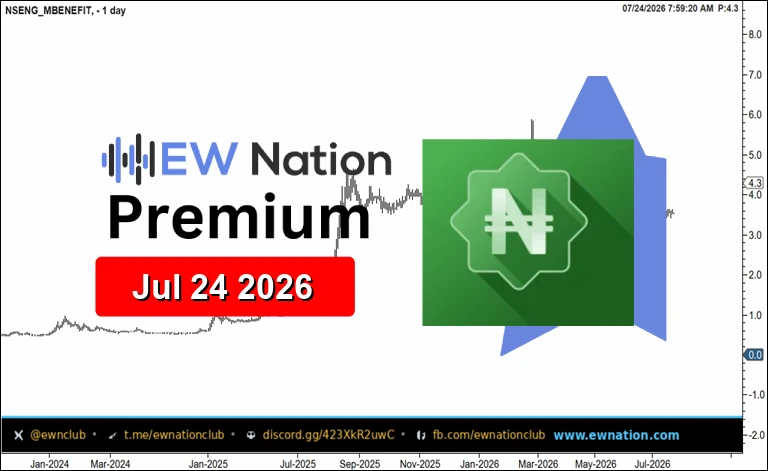
On the 4-hour chart, MBENEFIT has completed a clear five-wave corrective decline from the wave B high, with wave (v) of C and the broader wave ii base forming near the 2.7–2.8 zone, a level that aligns with the 61.8% retracement of the prior impulsive advance visible on the daily timeframe. The daily chart confirms this structure, showing that wave i extended sharply from the base established after the long wave II consolidation, and the current wave ii pullback has respected the 61.8% Fibonacci retracement at 2.7, a textbook corrective level for a second wave in a high-momentum impulse. Both timeframes now project a wave iii advance as the next primary move, which Elliott Wave theory suggests should be the longest and most powerful segment of the five-wave sequence from the major Wave II low. A confirmed base at or above 2.7–2.8 on the 4-hour chart, followed by impulsive price action reclaiming the 3.5–4.0 zone, would validate the wave iii launch scenario and open upside targets toward 6.5 and beyond. Traders should watch for a clean break and hold above the 4.3 current price with expanding volume as early confirmation that the corrective structure has concluded.
Bottom Line: Wave ii base tightening near 2.7 Fib support; wave iii advance toward 6.5+ expected next