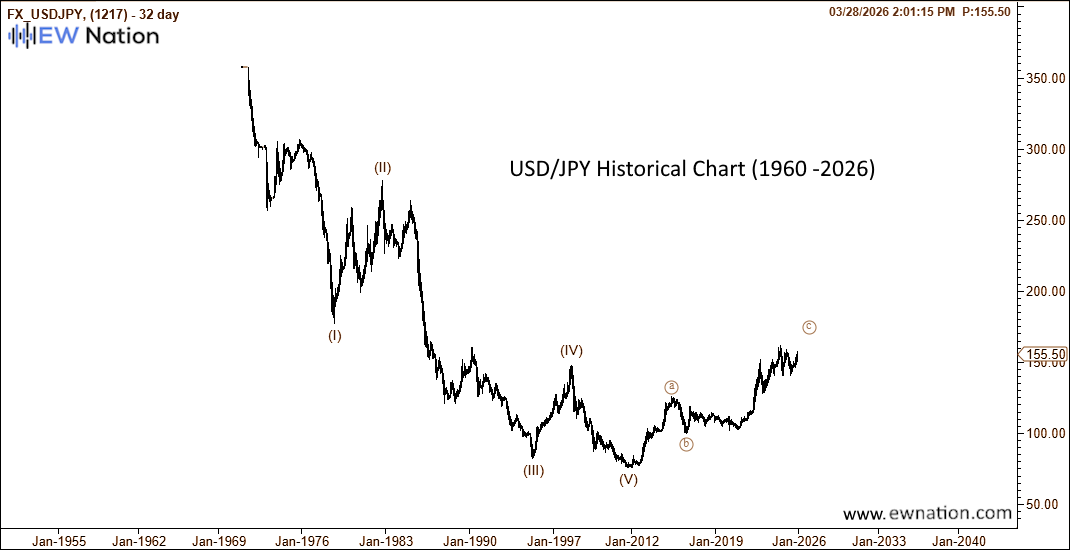
The initial rally from 75.55 to 125.86 is a five-wave impulse, marked (I)-(II)-(III)-(IV)-(V) in wave A-circled, where the impulse structure of wave (I) can be seen, as well. Wave B-circled took the shape of a (W)-(X)-(Y) double zigzag, ending at 98.99 in June, 2016. If this count is correct, the following surge to 161.95 so far must be part of wave C-circled.
The entire structure from the October 2022 high at 151.95 looks like a complete triangle correction now, marked a-b-cd-e. If that’s the case, wave C-circled is not over yet. The only place within a five-wave impulse where a triangle can fit is in its fourth wave, marked here as wave (IV). In the case of USDJPY, this would mean that a new multi-decade high can be expected in wave (V), before the bears return.
According to the theory, a three wave correction follows every impulse. That’s why the post -2011 surge stands for a giant ABC correction as seen from the weekly chart below.