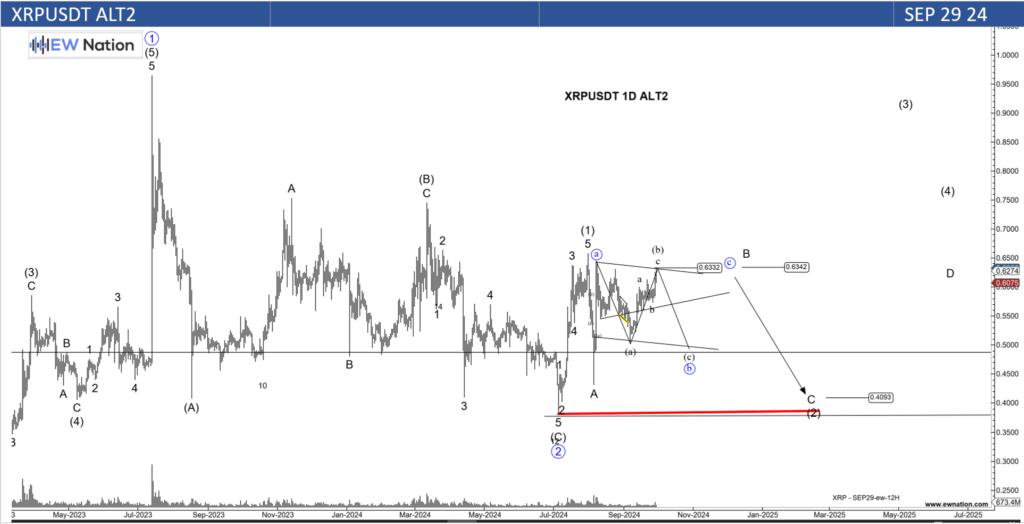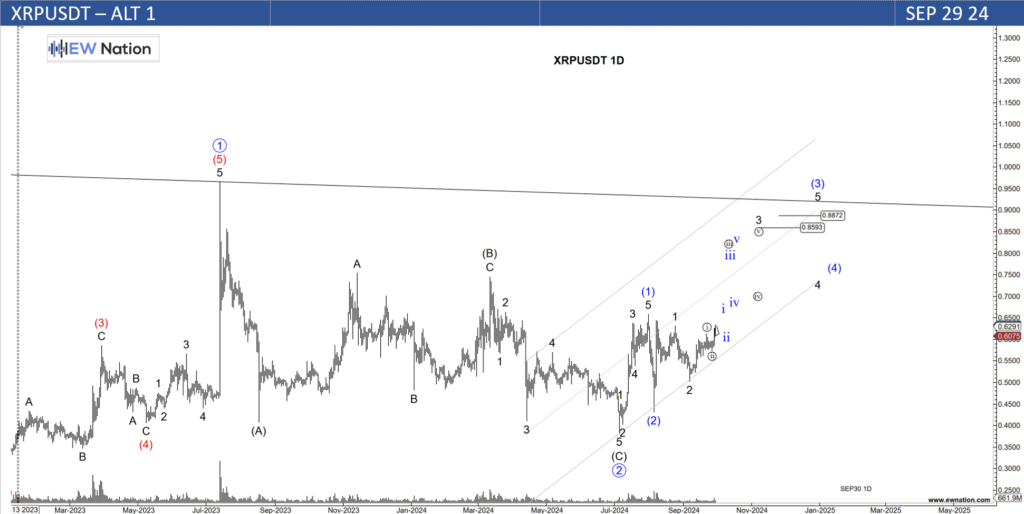
XRPUSDT completed wave 2 (circled blue) and headed for wave 3. If the count is right then we will continue progress to the wave 3 position.
The Elliot Wave chart below suggests that sub wave 3 has been hit at 0.632, we will expect a triangle formation for the wave 4 position before we continue to make progress.
There is a bearish alternative which has been indicated in the second chart below.
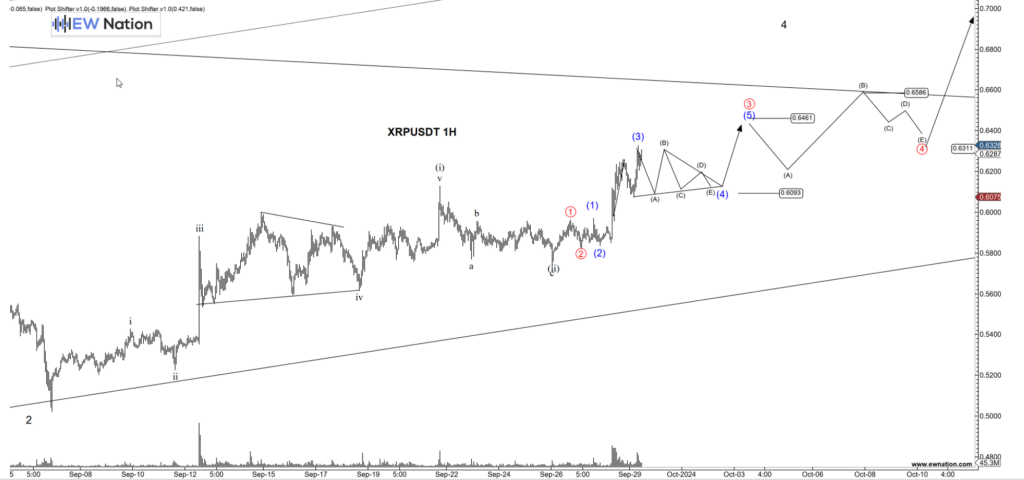
This bearish alternative will see for further weakness for wave 2 and ultimately take us to 0.4 region.
