Bottom Line: Wave 2 base tightening at 16.7–17.5 support; wave 3 launch targets above 24.0
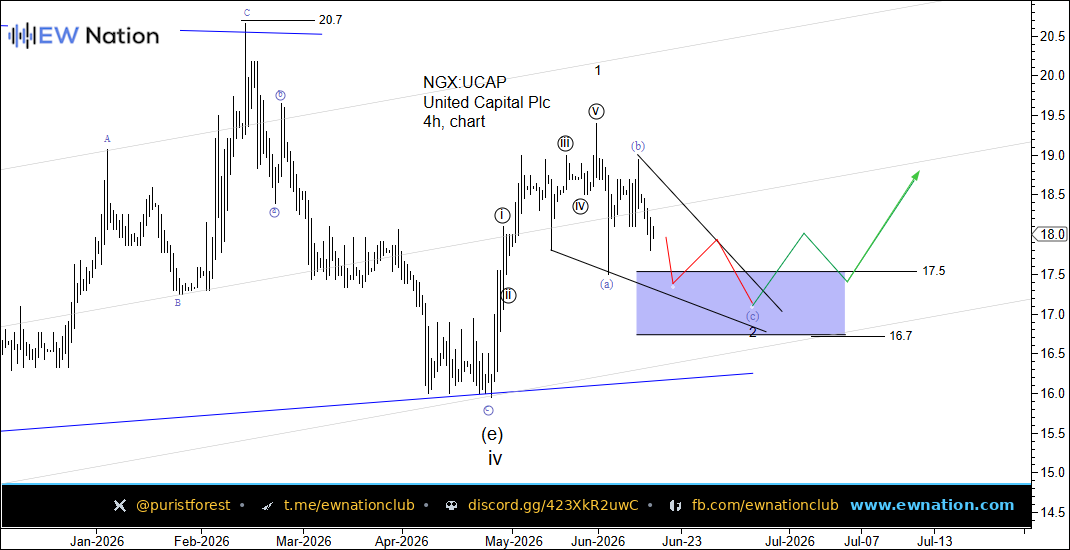
UCAP — Wave 2 Correction Tightening; Wave 3 Advance Loading Above 17.5
United Capital Plc remains one of Nigeria’s most diversified investment banking and asset management franchises, with revenues spanning securities trading, trust services, fund management, and structured finance. The firm has benefited from elevated fixed-income yields on the NGX as the CBN’s hawkish monetary stance kept short-term rates high, supporting fee income from money market and bond products. However, equity market volatility in H1 2026 has weighed on advisory and brokerage revenues, creating a mixed earnings backdrop heading into mid-year results. Asset under management growth remains a structural positive, with retail investor participation in Nigerian capital markets continuing to deepen. The naira’s relative stabilisation in 2026 has reduced FX translation losses that had previously distorted bottom-line figures, a meaningful tailwind for the group. Valuation remains undemanding relative to peers given the quality of the franchise, and any earnings beat in the upcoming H1 disclosure could serve as a fresh catalyst. The broader NGX financial services sector continues to attract domestic institutional inflows as pension funds rebalance toward equities following the 2025 regulatory reforms. Near-term sentiment is cautious but the medium-term investment case for UCAP hinges on the anticipated resumption of the primary impulse wave sequence.
Chart Update — 4H and 1 Day
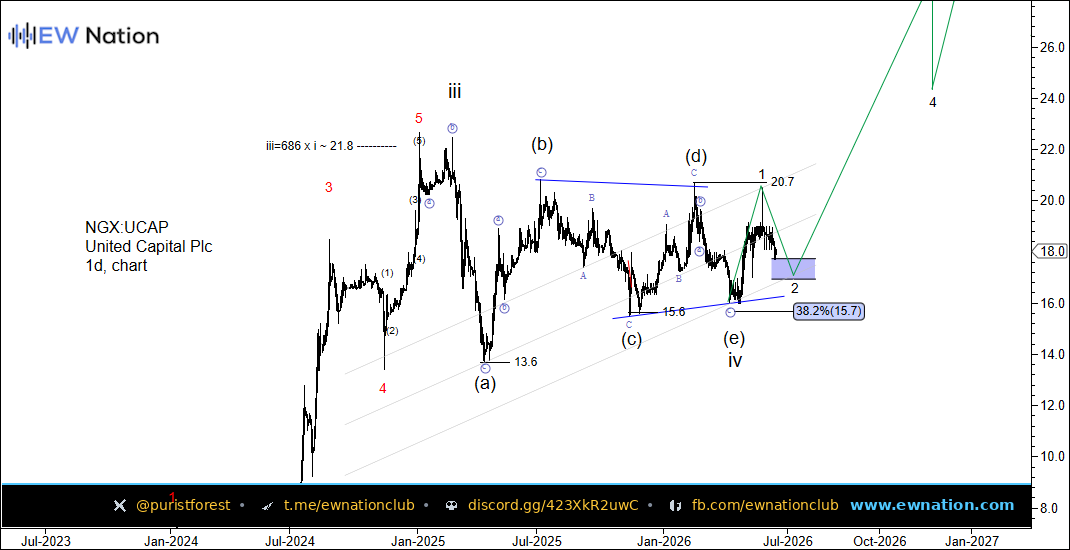
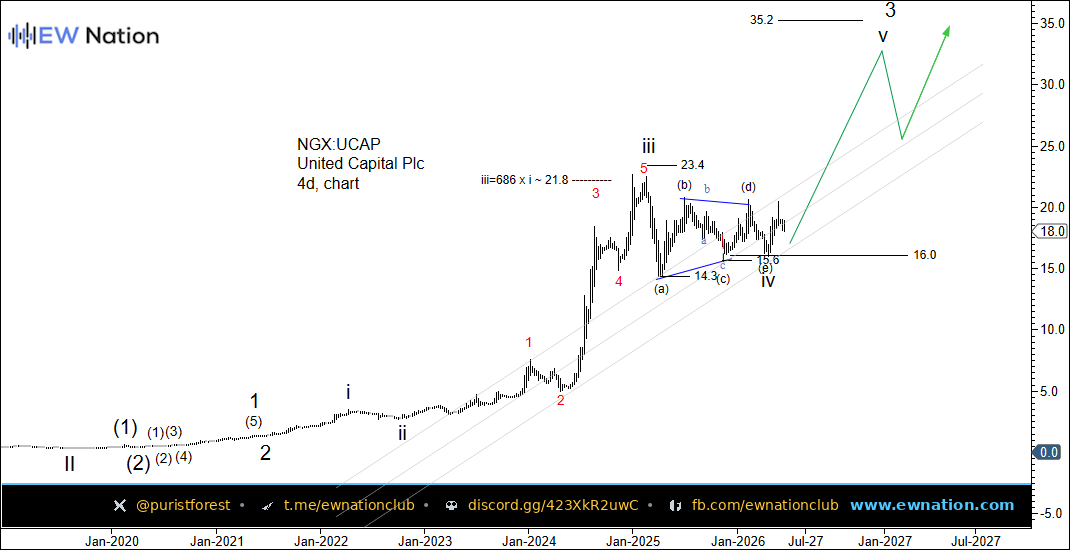
In our last update on April 13, wave iv was completing a contracting triangle near 16.0 on the daily chart, with the green arrow projecting a wave 5 advance toward the mid-twenties. The current daily chart confirms that wave iv concluded its expanded flat-triangle structure at the (e) low and price has since launched wave 1 of the new advance, tagging 20.7 before pulling back into what is now labelled wave 2. Wave 2 is retracing into the 16.7–17.5 support box, with the 38.2% Fibonacci retracement sitting at 15.7 as the deeper invalidation boundary. On the 4-hour chart, a small five-wave impulse from the (e) low completed wave 1, followed by an a-b-c zigzag decline into the shaded support zone, consistent with a standard wave 2 retracement. A sustained reclaim of 17.5 on a closing basis would confirm wave 2 is complete and open the path toward wave 3 targets well above 24.0. Both timeframes continue to respect the rising parallel channel structure that has guided price since the 2024 lows.
Bottom Line: Wave 2 base tightening at 16.7–17.5 support; wave 3 launch targets above 24.0
UCAP — Wave 2 Correction Tightening; Wave 3 Advance Loading Above 17.5