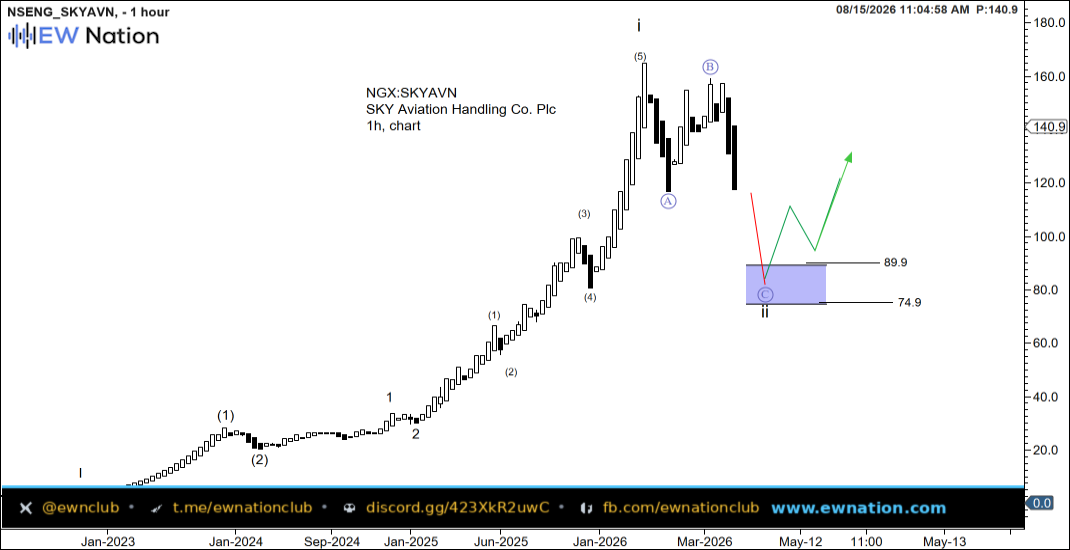
Bottom Line: Wave C Correcting Into Strong Demand Zone; Wave ii Base Near 74.9–89.9 Sets Up Next Impulse
SKYAVN — Ground Handling Recovery Intact; Wave C Pullback Targets Key Buy Zone Before Next Leg
Sky Aviation Handling Co. Plc (NGX: SKYAVN) sits at the operational heart of Nigeria’s recovering aviation sector, providing ground support services across major domestic and international terminals. Nigeria’s air passenger traffic has posted consecutive quarters of growth as suppressed post-pandemic demand normalises, directly benefiting handling and logistics operators like SKYAVN. The company’s revenue profile is tightly linked to flight movements, and the sustained increase in airline activity — driven by both legacy carriers and newer low-cost entrants — is translating into improved throughput volumes. On the macro side, the naira’s managed stabilisation has reduced imported cost pressures on aviation fuel and equipment maintenance, improving the operating margin outlook for the sector broadly. Earnings visibility has strengthened as contract renewals with major airlines tend to lock in multi-year revenue floors, reducing downside risk. Valuation at current levels remains attractive relative to peers given the operational leverage embedded in SKYAVN’s cost structure — as volumes scale, incremental margins widen disproportionately. The broader Nigerian aviation infrastructure push, including concession frameworks and terminal upgrades, provides a structural tailwind for compliant, established handlers. Investors are increasingly recognising SKYAVN as a proxy play on air traffic growth without taking on balance-sheet risk associated with the airlines themselves.
Chart Update — 4H
The 1-hour chart reveals a textbook Elliott Wave structure: SKYAVN completed a powerful five-wave impulse from the 2023 lows into the mid-2025 peak near the 170–175 zone, labelled wave i at the primary degree. Price has since entered a corrective ABC sequence, with wave A completing its decline and wave B retracing partially back toward 155–160 before rolling over into the current wave C leg. The projected wave C target sits in the 74.9–89.9 support zone, a demand area where the correction is expected to find exhaustion and buyers to reassert control. The green arrow projection on the chart anticipates a sharp reversal from that zone, launching the next primary impulse wave higher — wave ii of the larger sequence completing before wave iii accelerates. Traders should monitor price behaviour closely in the 75–90 range for reversal candlestick signals and volume confirmation before positioning for the next advance.