
In November 2024, we introduced our readers to a leading agribusiness company Ellahlakes, the...
According to the Elliot wave impulse waves show the direction of the larger trend, so in this case...
FIn a textbook case of investors getting carried away on a good story, the stock of FCMB Group Plc...
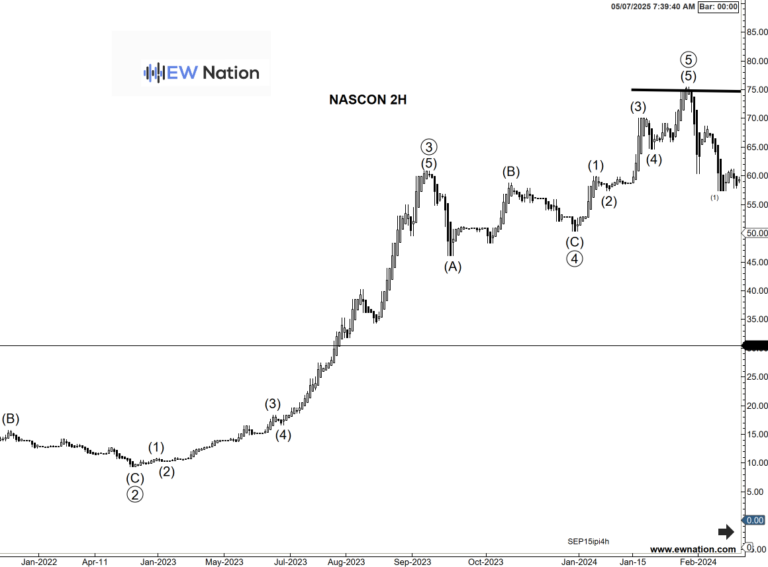
For over 20 years, Nigerian cocoa processing company had been unable to provide reliable...
With a solid financial foundation and strategic focus on retail expansion, Prestige Assurance Plc is...