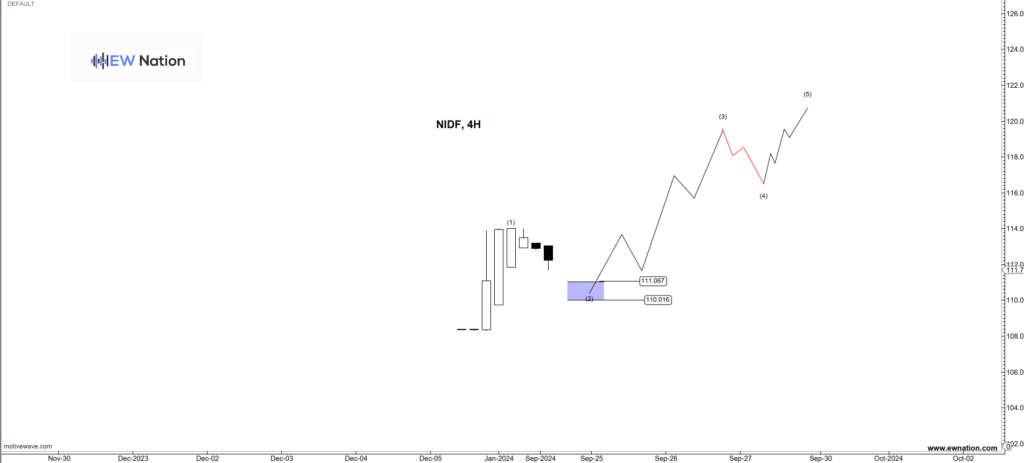
The Nigeria Infrastructure Debt Fund (NIDF), managed by Chapel Hill Denham, continues to solidify its position as a pivotal player in Nigeria’s infrastructure financing landscape. As of the nine-month period ending September 30, 2024, NIDF reported a Profit Before Tax (PBT) of ₦13.7 billion, marking a 24% year-on-year increase from ₦11.0 billion in the corresponding period of 2023 .
Financial Highlights:
Total Income: ₦15.1 billion for 9M 2024, up 28% from ₦11.8 billion in 9M 2023.
Interest Income: ₦12.6 billion, representing a 41% increase year-on-year.
Net Asset Value (NAV): ₦103.9 billion as of September 2024, a slight rise from ₦103.5 billion in December 2023.
The fund’s robust performance is attributed to its diversified portfolio of 25 infrastructure loans across sectors such as power generation, energy infrastructure, transportation, telecommunications, and social infrastructure.
Investor Returns and Distributions:
NIDF has consistently delivered attractive returns to its investors. For the first half of 2024, the fund distributed ₦8.17 billion to unitholders, reflecting its commitment to providing regular income . The fund’s infrastructure loan portfolio reported a weighted average annualized yield of 20.6%, with a weighted average tenor at disbursement of 9.2 years and a weighted average remaining life of 4.8 years .
Strategic Developments:
In a move to enhance investor value, NIDF introduced a Scrip Dividend program, allowing investors to receive dividends in the form of additional units. This initiative led to the listing of 218,084 new units on the Nigerian Exchange (NGX), increasing the total number of units from 960.9 million to 961.1 million .
Outlook:
With its strong financial performance, diversified investment portfolio, and innovative investor initiatives, NIDF is well-positioned to continue playing a crucial role in bridging Nigeria’s infrastructure financing gap. Its consistent returns and strategic growth initiatives make it an attractive option for investors seeking stable, long-term income.