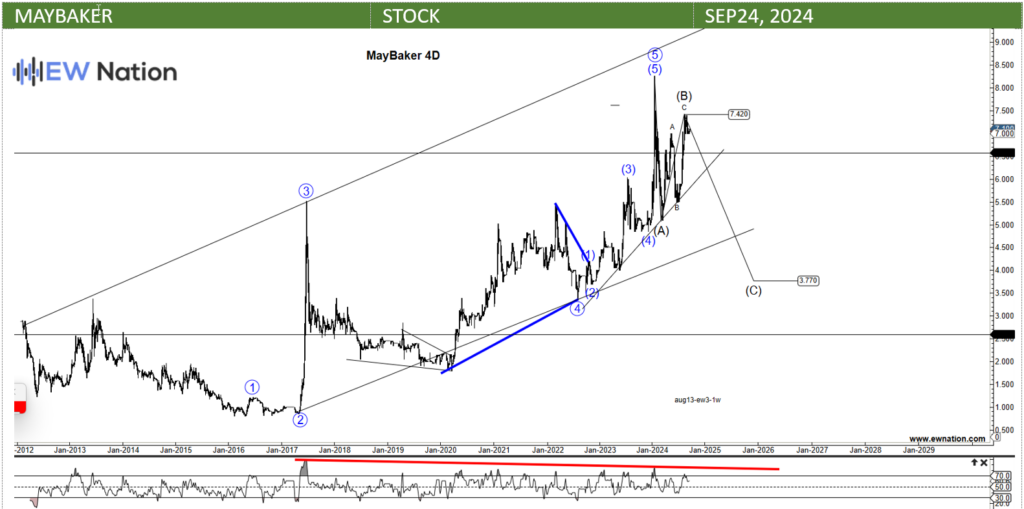
May & Baker Stock – A pattern 10 years in the making
May & Baker, a leader in the pharmaceutical industry, continues to demonstrate resilience and growth despite the challenges facing the sector. Specializing in the production of vaccines, pharmaceuticals, and consumer healthcare products, the company has strengthened its market presence through strategic partnerships and expanding its product portfolio. As the demand for healthcare services and products rises, May & Baker is well-positioned to capitalize on these opportunities.
In its latest financial report, May & Baker posted revenue of ₦12.5 billion, reflecting a 10% year-over-year increase, primarily driven by strong sales in its pharmaceutical and consumer healthcare divisions. Despite this growth, rising costs related to raw materials and inflationary pressures impacted profitability, with the company reporting a net income of ₦1.2 billion. However, May & Baker has been focusing on operational efficiency and expanding its production capacity to offset these challenges and improve margins.
Trading at a price-to-earnings (P/E) ratio of 9.2, May & Baker remains attractively valued compared to its peers in the pharmaceutical sector. Analysts are optimistic about the company’s growth prospects, especially given its continued investment in research and development, as well as its role in the production of vaccines, which is critical in Nigeria’s healthcare landscape. The company’s partnership with Themis Bioscience for the production of vaccines locally is expected to drive further growth in the coming years.
However, the company faces risks associated with Nigeria’s broader economic environment, including inflation, foreign exchange volatility, and regulatory shifts in the pharmaceutical industry. Despite these headwinds, May & Baker’s strategic focus on innovation, operational efficiency, and market expansion provides a positive outlook, making it an attractive option for investors looking for exposure to the growing healthcare and pharmaceutical market in Nigeria.