Bottom Line: Wave ii bottoming at 61.8% retracement near 4.3; wave iii breakout targets 9.1 and beyond
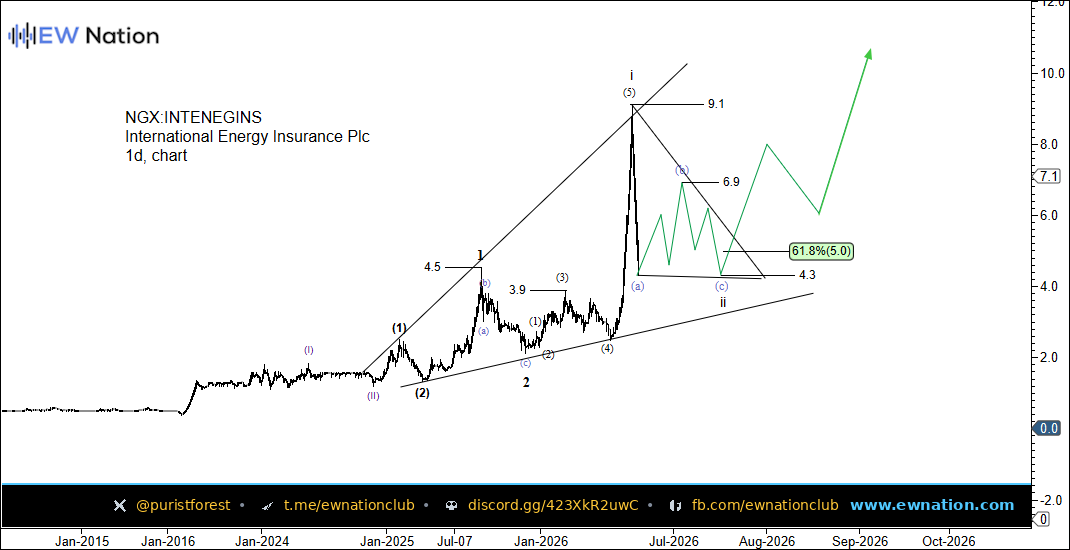
INTENEGINS — Corrective Wave ii Bottoming at 4.3; Wave iii Surge Targets 9.1 and Beyond
International Energy Insurance Plc remains one of the most strategically positioned underwriters on the Nigerian Exchange, with its core book tied directly to upstream and midstream oil and gas activity — a sector that continues to attract fresh capital inflows as Nigeria pushes to restore crude output toward 1.8 million barrels per day. The company’s premium income has benefited from rising insurable values across offshore platforms and pipelines, with energy insurance rates firming globally following a string of high-profile marine and energy losses in 2024 and 2025. Nigeria’s insurance sector penetration remains among the lowest in sub-Saharan Africa, which structurally supports long-term premium growth for specialised underwriters such as INTENEGINS that are not competing in the saturated retail segment. Regulatory tailwinds from NAICOM’s recapitalisation drive have also strengthened balance sheets across the sector, reducing counterparty risk and improving reinsurance treaty terms for compliant operators. The stock’s valuation remains undemanding relative to book value, and with the naira showing some measure of stability following CBN’s tightening cycle, foreign reinsurance obligations have become more predictable. Earnings visibility has improved materially entering the second half of 2026, and any upside surprise in H1 results could serve as a near-term catalyst to accelerate the technical breakout already developing on the chart.
Chart Update — 4H and 1 Day
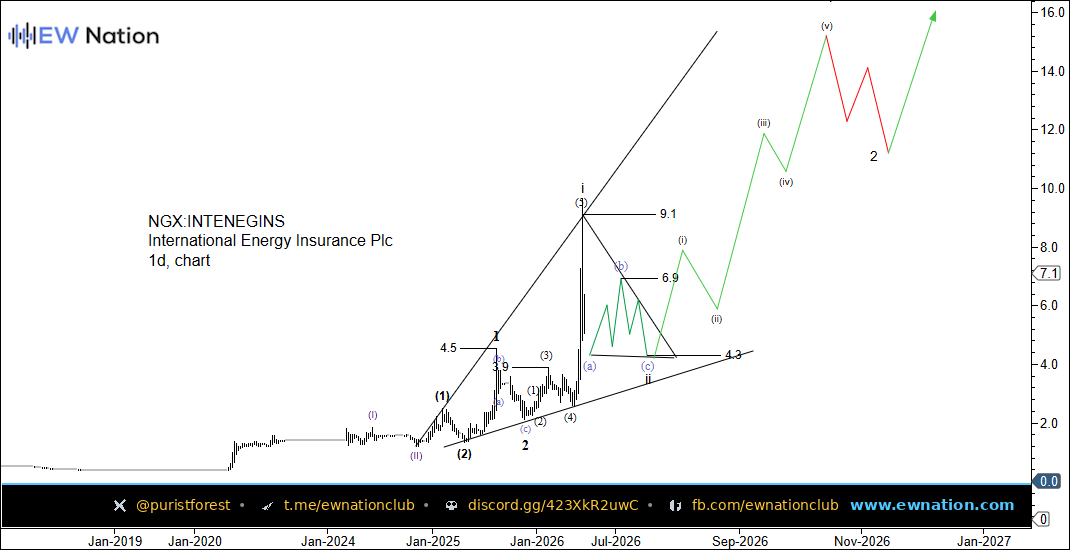
The daily chart for INTENEGINS presents a well-structured Elliott Wave sequence in which a powerful five-wave impulse completed wave i at the 9.1 level, launching from sub-1.0 lows and channelling steeply higher within a rising parallel structure. Price has since entered a corrective wave ii pullback, unfolding as an a-b-c zigzag that is now compressing into a terminal wedge-like formation with support confluencing near the 4.3 level — precisely at the 61.8% Fibonacci retracement of wave i, a textbook wave ii reversal zone. The corrective structure shows internal waves (a) and (b) already complete, with wave (c) grinding toward the lower boundary of the rising channel, suggesting exhaustion of selling pressure is imminent. Once wave ii confirms its low at or above 4.3, the Elliott Wave count projects a wave iii advance that should comfortably surpass the 9.1 wave i peak, with an extended target range opening toward the 12–16 zone as mapped in the alternate count showing sub-waves (i) through (v) developing within the broader third wave. A daily close back above 6.9 would be an early confirmation that wave ii is complete and wave iii is underway.
Bottom Line: Wave ii bottoming at 61.8% retracement near 4.3; wave iii breakout targets 9.1 and beyond