Bottom Line: Wave IV Triangle Nearing Completion — Wave V Breakout Toward $5,437 and Beyond on Confirmation

XAUUSD — Central Bank Demand and Dollar Weakness Fuel the Base; Wave IV Triangle Tightening Before Final Surge
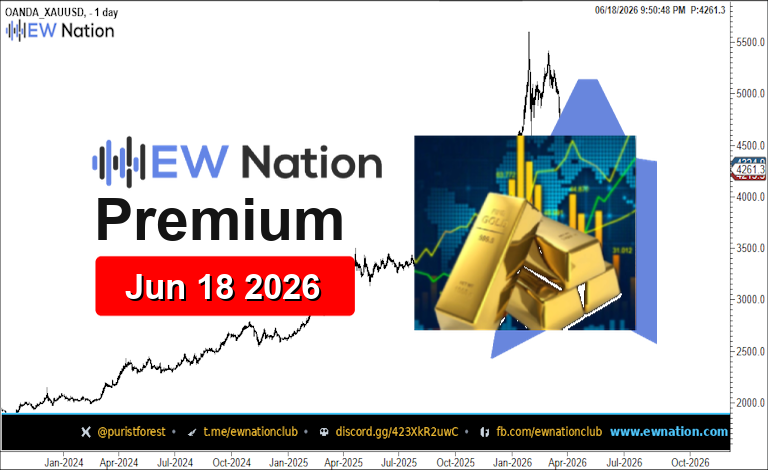
Gold trades at $4,261 on June 18, 2026, holding within a broad corrective structure after printing a historic high of $5,419 in early 2026, a move driven by sustained central bank accumulation, persistent US fiscal deficit concerns, and a structurally weaker dollar environment. Global central banks, particularly in emerging markets, continued net purchasing through Q1 2026, reinforcing a demand floor that has prevented any deep retracement despite the sharp pullback from the peak. The Federal Reserve’s delayed rate normalisation cycle and sticky core inflation across G7 economies have kept real yields suppressed, maintaining gold’s opportunity cost advantage over treasuries. Geopolitical risk premiums remain embedded in the gold price, with ongoing Middle East and Eastern European tensions sustaining institutional safe-haven allocations into the metal. ETF outflows that weighed on gold through mid-2025 have reversed course, with total known ETF holdings recovering meaningfully through Q1 and Q2 2026 as fund managers rotated back into hard assets amid equity market volatility. At current levels, gold trades at a moderate discount to its 2026 peak, offering a technically attractive re-entry point for medium-term bulls who missed the initial impulse. The broader macro setup — dollar weakness, geopolitical tension, and de-dollarisation trends among BRICS economies — remains constructive for a renewed advance into the second half of 2026.
Chart Update — 4H and 1 Day
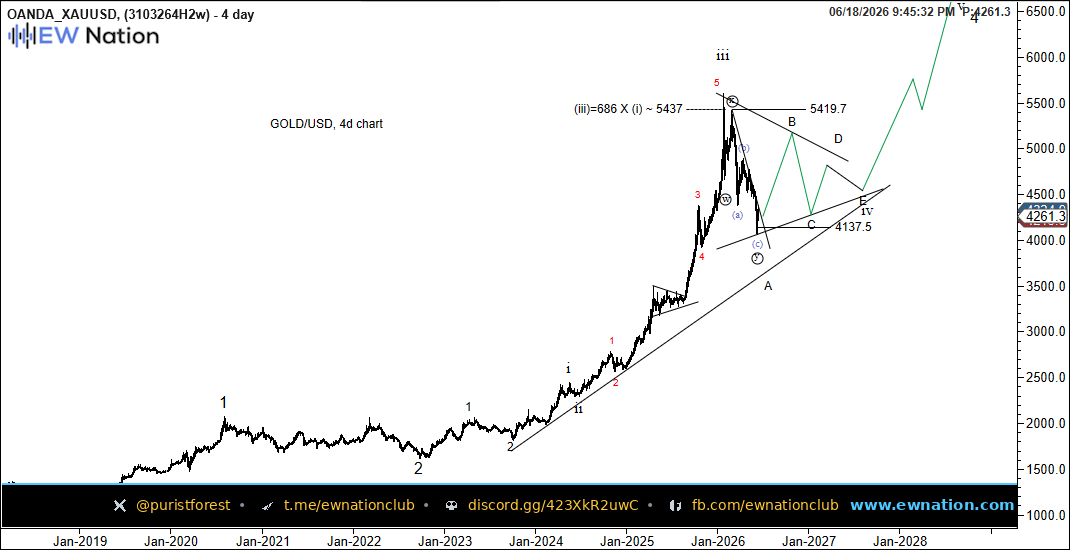
The 8-hour chart shows price declining within a falling parallel channel from the $5,419 high, tracing out a clearly defined five-wave corrective structure labelled (1) through (5) with a low target around $4,137.5, consistent with a Wave A completion. The 4-day chart contextualises this corrective move as Wave IV within the larger impulse sequence, where price is forming a contracting triangle pattern with legs A through E converging toward the apex near the $4,137–$4,261 zone. Wave IV triangles in Elliott Wave theory are typically time-consuming, sideways-to-lower consolidations that precede the final and often most dynamic fifth wave advance, which on the 4-day chart projects toward the $5,437 extension level and potentially beyond toward $6,000+. A confirmed break above the descending upper channel boundary on the 8-hour chart, currently acting as trendline resistance, would be the first structural signal that Wave E of IV is complete and the Wave V impulse is beginning. Continued rejection at this trendline resistance would extend the triangle consolidation and delay the bullish resolution, but would not invalidate the broader bullish count so long as $4,137.5 support holds.
Bottom Line: Wave IV Triangle Nearing Completion — Wave V Breakout Toward $5,437 and Beyond on Confirmation