
Oando Plc, a leading energy company in Nigeria, has shown resilience despite persistent operational challenges. The company recently reported a 43% year-over-year growth in revenue, reaching ₦2.9 trillion for the 2023 financial year. This strong performance was driven by increased production and trading volumes, especially in crude oil, which grew by 50% year-over-year, offsetting declines in refined product volumes.
Key Financial Highlights:
- Profit After Tax: Oando recorded a net profit of ₦60.3 billion in 2023, a significant turnaround from a ₦81.2 billion loss in the previous year. This improvement was supported by foreign exchange gains and enhanced production efficiencies
.
- Upstream Operations: Total production increased by 12% year-over-year to 23,258 barrels of oil equivalent per day (boepd), with crude oil contributing 6,211 barrels per day.
- Trading Activities: The company sold 32.8 million barrels of crude oil in 2023, reflecting its strong global trading network.
H1 2024 Update:
In the first half of 2024, Oando’s revenue grew by 51% year-over-year to ₦2.0 trillion. However, production faced setbacks due to sabotage in the Niger Delta, resulting in a 7% decline in total output to 24,389 boepd.
Strategic Moves:
Oando recently acquired NAOC Ltd, a significant step toward increasing its reserves and production capacity. The company’s strategic focus includes enhancing production and integrating newly acquired assets, which is expected to drive long-term growth.
Outlook:
While Oando continues to face challenges such as pipeline vandalism and operational disruptions, its focus on scaling production and leveraging exchange rate gains positions it for future growth. Investors will monitor its ability to sustain profitability amidst fluctuating oil prices and operational hurdles.
Oando’s strong financial recovery and strategic acquisitions highlight its commitment to delivering value to stakeholders in a dynamic energy market.
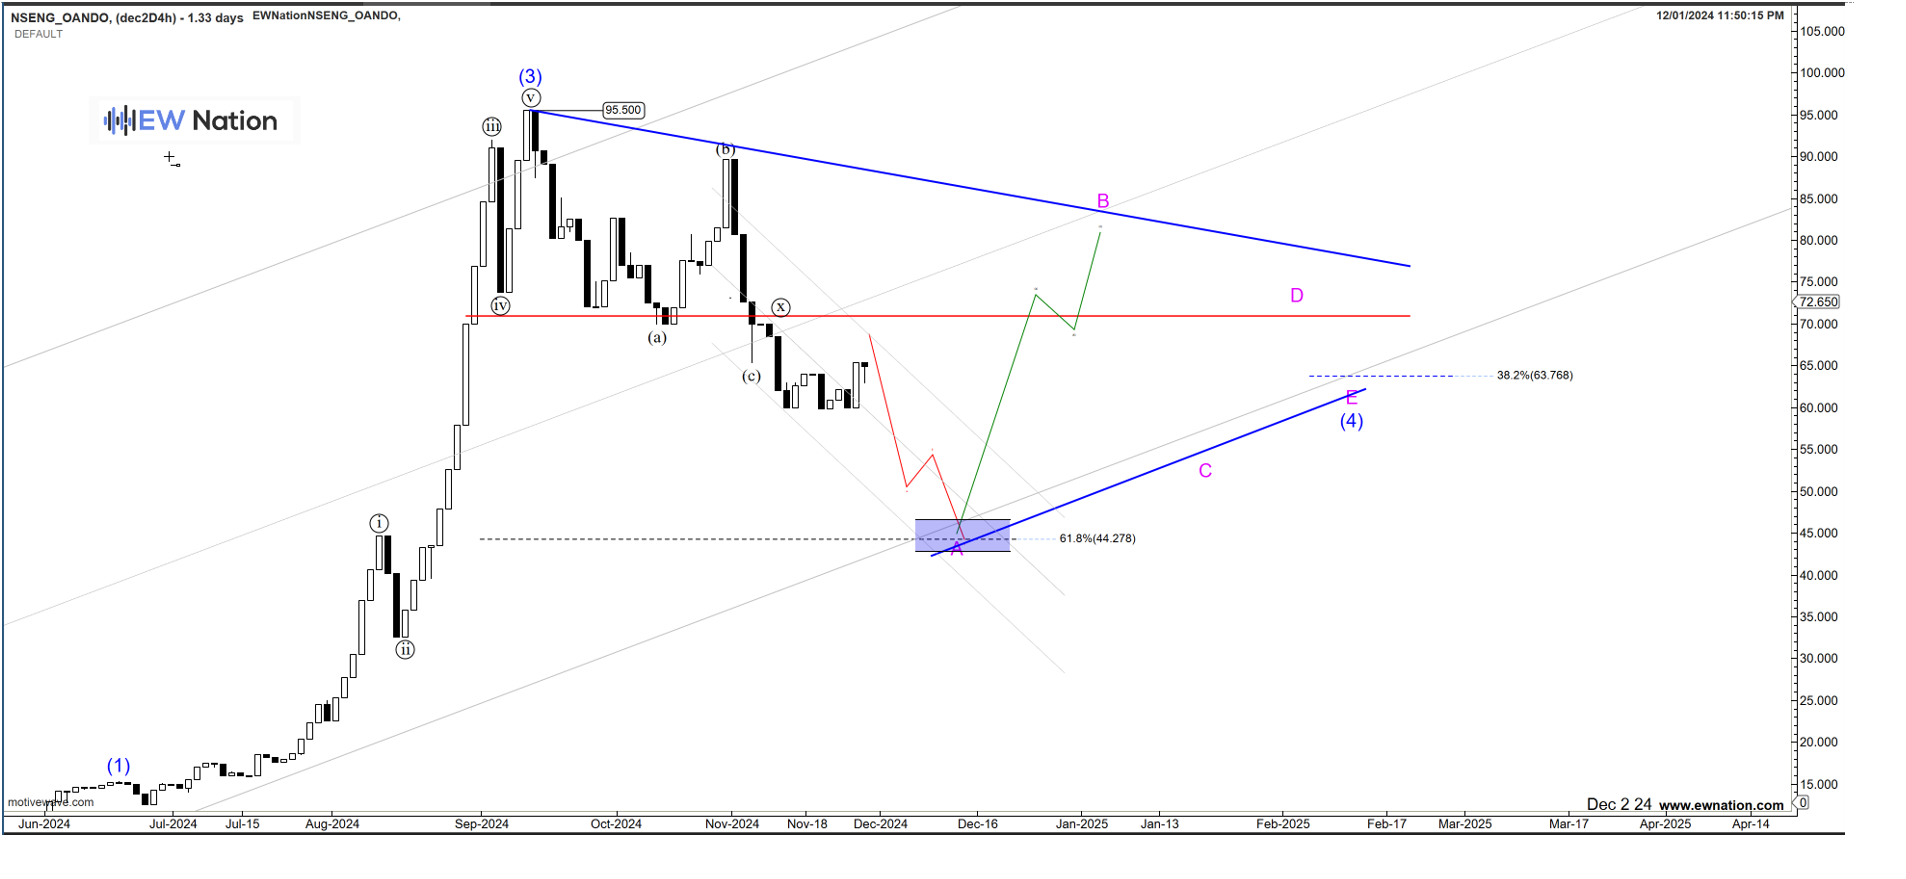
The Elliot Wave chart indicates that Oando has completed Wave 3 in Q4 2024, the resulting sell off from the 95.5 top is seen as A wave of an unfolding triangle A-B-C-D-E. Targets for Wave A are 50% – 61.8%, upon completion of this wave, according to the Elliot Wave Theory, then we will expect a reversal for the B wave taking us above the resistance level at 72.5.