Gartner, Inc. (Ticker: IT) Financial Analysis: Nearing a Temporary High?
Gartner, Inc. (IT), a global leader in research and advisory services, has seen its stock price soar in recent years, fueled by consistent revenue growth and increasing demand for data-driven business solutions. With a diversified client base that spans technology, healthcare, and government, Gartner has positioned itself as a critical partner for businesses seeking insights and strategies in IT, supply chain, and finance.
In 2023, Gartner reported annual revenues of $5.9 billion, up 10% from the previous year, largely driven by its subscription-based Research segment, which generated $4.3 billion in revenue. The company’s consistent revenue growth and strong operating margins of around 22% have made it a solid performer in the stock market. Its shares have appreciated dramatically over the last decade, with prices climbing from around $60 in 2013 to over $350 in 2023, delivering a compound annual growth rate (CAGR) of approximately 18%.
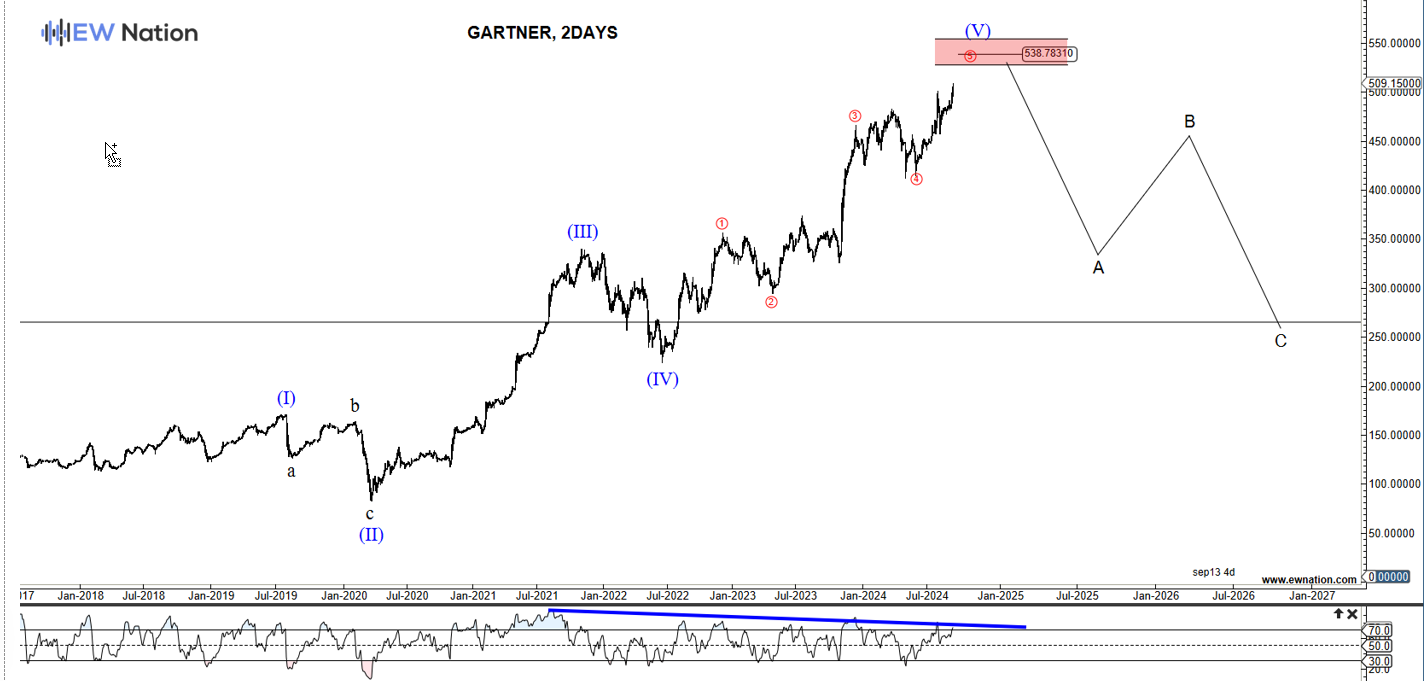
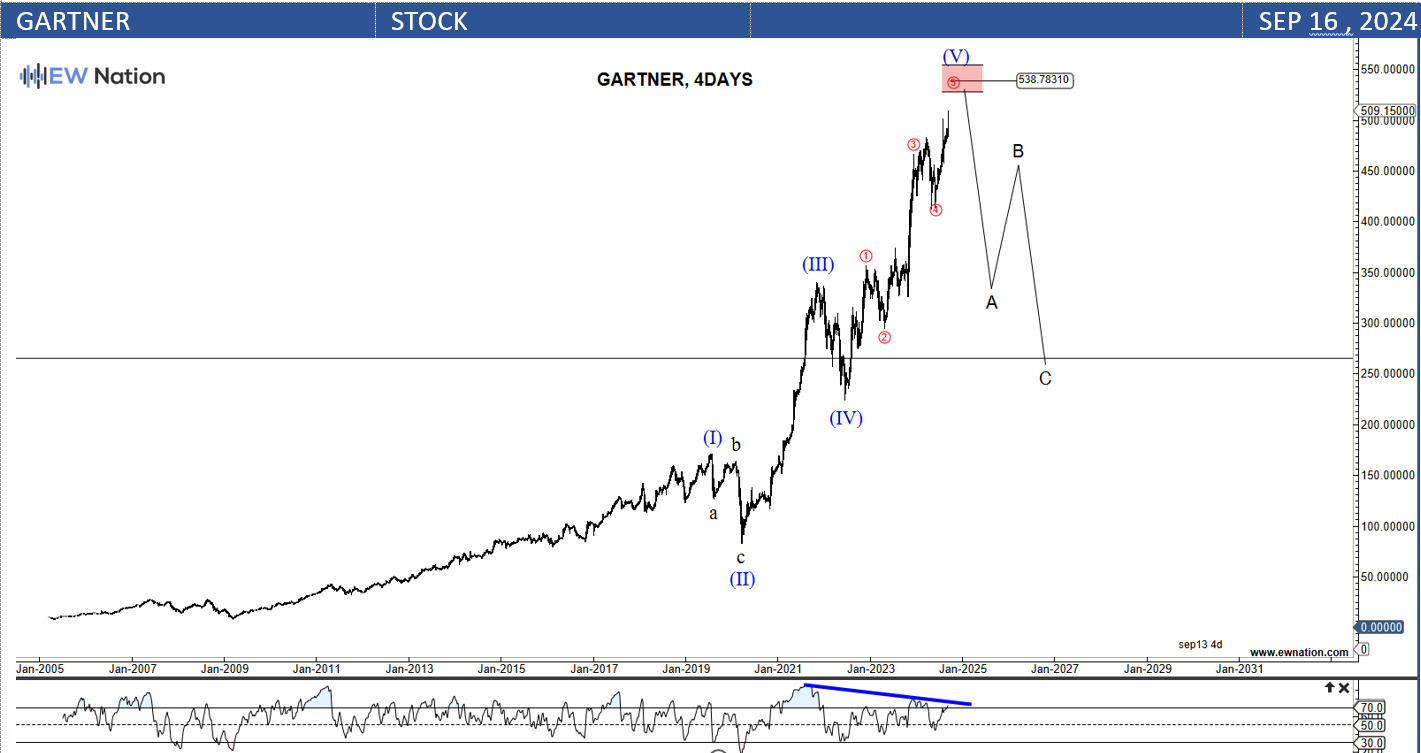
However, Gartner’s stock may have reached a temporary peak, with concerns of a potential pullback looming. According to Elliott Wave Theory, Gartner’s stock is showing signs of nearing the end of its current bullish wave and has entered a late-stage wave, indicating that a correction may be on the horizon.
Currently, Gartner trades at a price-to-earnings (P/E) ratio of 27, which is higher than the industry average. This elevated valuation suggests that much of the company’s future growth may already be priced in, making the stock vulnerable to profit-taking. Additionally, recent market sentiment has shown signs of waning as some investors lock in gains after the significant run-up in share prices. Despite generating a robust $1.1 billion in free cash flow and maintaining a manageable debt-to-equity ratio of 1.8, technical indicators are signaling that the stock is entering overbought territory.
Gartner’s future remains bright due to strong underlying demand for its research and advisory services, particularly as industries continue to embrace digital transformation. However, the recent rally may have pushed the stock into overextended territory, and investors should be cautious of a potential sell-off in the near term.
In summary, while Gartner’s long-term growth potential remains intact, the current stock price may reflect a temporary high. Elliott Wave Theory suggests that the stock could be due for a correction, and a period of consolidation or pullback may present a better entry point for investors. Those holding shares may want to consider locking in some gains as the stock approaches resistance levels, with a potential sell-off on the horizon.
The Four day chart above shows that Gartner is unfolding in a textbook five-wave impulse between 2005 and 2024. The pattern is labeled I-II-III-IV-V, where wave V is currently in progress. According to the Elliot Wave theory, a three wave correction follows every impulse. We then expect that once the Wave V ends, a significant move to the downside will ensue in three corrective moves.