Bottom Line: Wave 2 double correction complete; wave 3 impulse building from multi-year base near 1.0
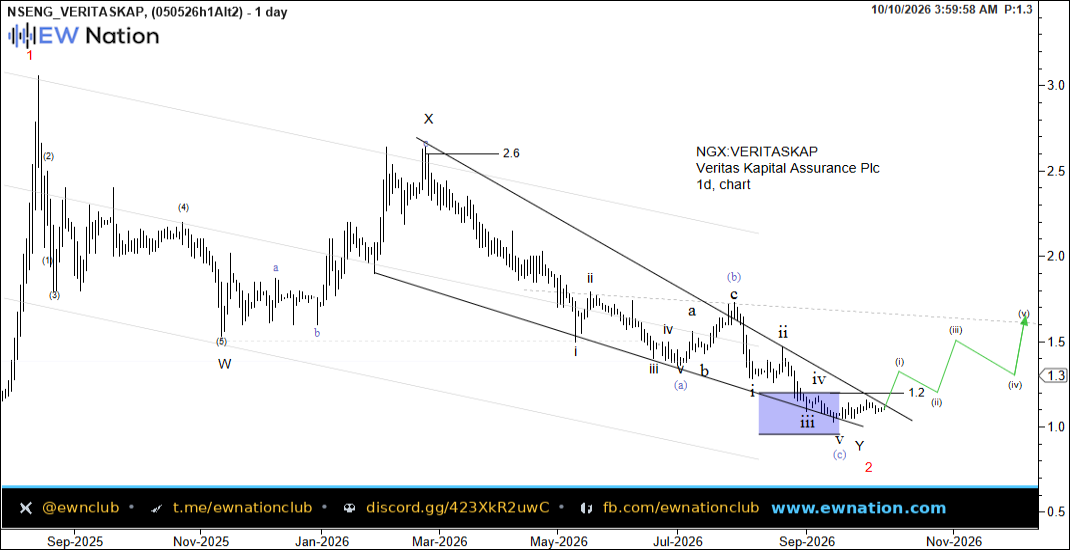
VERITASKAP — Insurance Sector Tailwinds Build as Wave 2 Low Firms at Multi-Year Support
Veritas Kapital Assurance Plc operates within Nigeria’s non-life insurance segment, a sector that has historically been underpenetrated but is now gaining renewed regulatory and institutional attention under the National Insurance Commission’s recapitalisation directive. The NAICOM-driven recapitalisation exercise, which mandates minimum capital thresholds for all insurers, is acting as a structural catalyst, forcing consolidation and improving balance sheet quality across the industry. For smaller insurers like Veritas Kapital, this environment creates both pressure and opportunity — those that meet capital requirements are likely to benefit from industry rationalisation and a growing pool of compulsory insurance products. Nigeria’s broader macroeconomic backdrop, while still challenged by inflation and currency pressures following the naira’s managed float reforms, has paradoxically lifted nominal premium income across the sector as insured values adjust upward. Veritas Kapital has historically traded at a significant discount to book value, reflecting the market’s scepticism around earnings consistency and claims management, yet this depressed valuation also sets a low bar for re-rating should earnings visibility improve. With Q1–Q2 2026 data suggesting modest underwriting improvement across mid-tier insurers, and with equity market participation in Nigeria rising on the back of improved real returns, VERITASKAP sits at an inflection point where fundamental improvement could accelerate price discovery. The stock’s prolonged decline from its 2025 peak has compressed it toward levels that historically attracted value-oriented positioning in comparable Nigerian financial sector names.
Chart Update — 4H
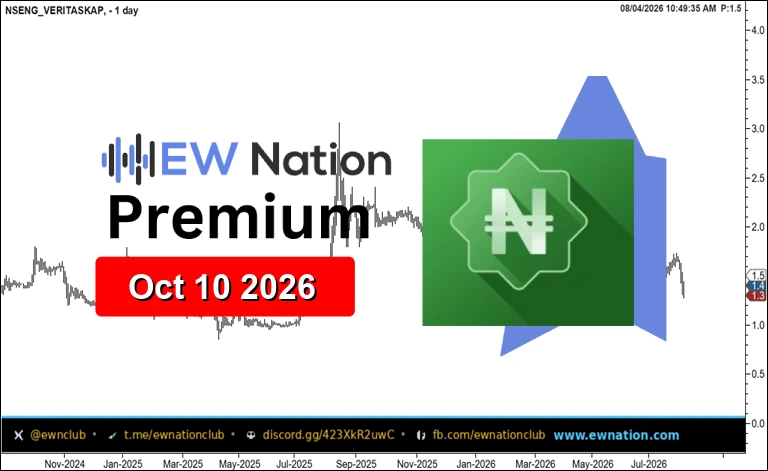
The daily chart for VERITASKAP presents a complex corrective structure unfolding from the March 2026 high marked as wave X, with price completing a W-X-Y double correction into the September 2026 low labelled wave 2. Within wave Y, a clear five-wave impulse decline into the (c) low near the 1.0 area appears to have concluded, with the highlighted consolidation zone in the blue shaded region marking the likely terminal wave iii–v sequence of the final leg down. From that base, price has begun recovering with an initial impulsive structure labelled waves (i) and (ii), and the projected path suggests a developing wave (iii) advance targeting the 1.2–1.5 zone before a shallow (iv) pullback sets up the final (v) push toward the 1.6–1.8 area. A sustained close above the intervening swing high near 1.2 would serve as early confirmation that wave 3 of a larger degree is underway, with the prior X-wave high at approximately 2.6 representing the upper boundary of the broader recovery thesis.