
Bottom Line: Wave 2 Zigzag Targeting 142–160 Zone Before High-Conviction Wave 3 Advance Resumes
NASCON — Salt Market Dominance Intact; Wave 2 Corrective Base Forming Between 142–160
Nascon Allied Industries PLC remains one of Nigeria’s most defensible consumer staples plays, commanding a dominant position in the country’s industrial and table salt market through its Dangote Group parentage and integrated production infrastructure. As Nigeria’s inflationary environment continues to squeeze discretionary spending, essential commodity producers like Nascon benefit from relatively inelastic demand, providing a floor to revenue volumes even as purchasing power erodes across lower-income households. The company’s pricing ability has been a key lever in recent periods, with naira depreciation pushing up input and logistics costs but also justifying pass-through price increases that have supported top-line growth in naira terms. Nascon’s exposure to food processing, oil and gas, and water treatment segments — all of which require industrial salt — diversifies its revenue base beyond the retail consumer and adds institutional demand stability. Valuation remains attractive relative to Nigerian consumer peers given the company’s consistent dividend history, low capital intensity in its core operations, and the strategic backing of Dangote interests which underpin supply chain resilience. The macro backdrop, while challenging on the cost side, continues to favour essential commodities as Nigerian households and industries maintain baseline consumption, reinforcing Nascon’s earnings visibility into the second half of 2026.
Chart Update — 4H
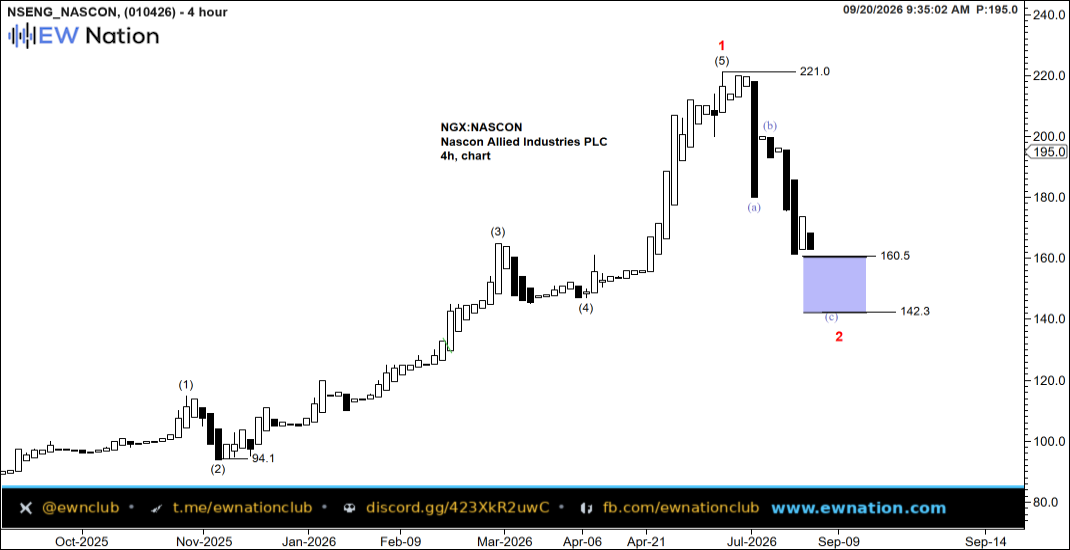
The 4-hour chart shows NASCON completing a textbook five-wave impulse from the October 2025 lows near 94.1 all the way up to the Wave 1 peak at 221.0, a powerful advance that unfolded through clearly identifiable sub-waves including a Wave 3 extension through the March–April 2026 period and a final Wave 5 thrust into the July 2026 high. Price is now correcting that entire impulse in what is labelled a Wave 2 decline, structured internally as an A-B-C zigzag with Wave (a) completing the initial sharp leg down, Wave (b) producing a modest counter-rally, and Wave (c) now extending toward the target zone highlighted between 142.3 and 160.5. The current price of 195.0 is still above the target box, suggesting Wave (c) has further to travel before exhaustion, and traders should watch for a deceleration of selling momentum and a base-building sequence within the 142–160 zone as the signal that Wave 2 is completing. A confirmed reversal from that demand zone would set the stage for a high-conviction Wave 3 advance that, by Elliott Wave progression, should ultimately surpass the 221.0 Wave 1 high by a significant margin.